
Sentinel-5P Data Guide
When we think about satellite data we tend to think of the heatmap-like overlays of some variable over a map. These images usually suggest that we have quite a dense data set that gives us a complete and unambiguous impression of the world. In practice these maps are usually made by aggregating a lot of data either over a longer time period. While it is pretty amazing that you can measure things on earth from outer space in such a high resolution at such a huge scale, when you look at the raw data you quickly realize that they also come with some important limitations. This is why in this text we would like to give you a short overview about what you can expect from this data and what kind of questions you can tackle with it.
What you see is what you get
First, let’s start with how the Sentinel-5P’s instruments actually measure pollutants. The method used to estimate the concentrations of the chemical compounds is spectrophotometry. You can think of this as a camera with more than just your usual RGB-values, also extending into wavelengths not visible to the human eye. So the spectrophotometer on the Sentinel-5P satellite takes pictures of the earth and each pixel corresponds to one measurement point (it does so actually not so much in the way of a conventional photo that is two dimensional, but rather one line at a time, like a scanner). This raw data is the Level-0 data product provided by the ESA. The concentrations of chemical compounds can then be inferred from the absorption of light they cause in different wavelengths(see also figure 43 in the description of the sensors on the mission page). Luckily, the ESA also provides this derived information in form of their Level-2 data products, which are the ones we are using as a basis for Emissions API.
From this explanation of the measuring principle we can already see two gotchas of the data: first, the measurement needs light and, second, the measurements are the sum of the concentrations of a compound between the earth’s surface and the satellite rather than ground values (although for ozone you get only the troposhperic part of this column).
The first fact means that we will never have data at night. The spectrophotometer does not have an active light source and it needs the sunlight in order to work. In the image below from the 1st of January 2020 you can see that measurements start only below a certain latitude (see this blog entry for a higher resolution version of this image). That is due to the polar night that makes it continuously too dark for the satellite’s intruments to work so close to the north pole.
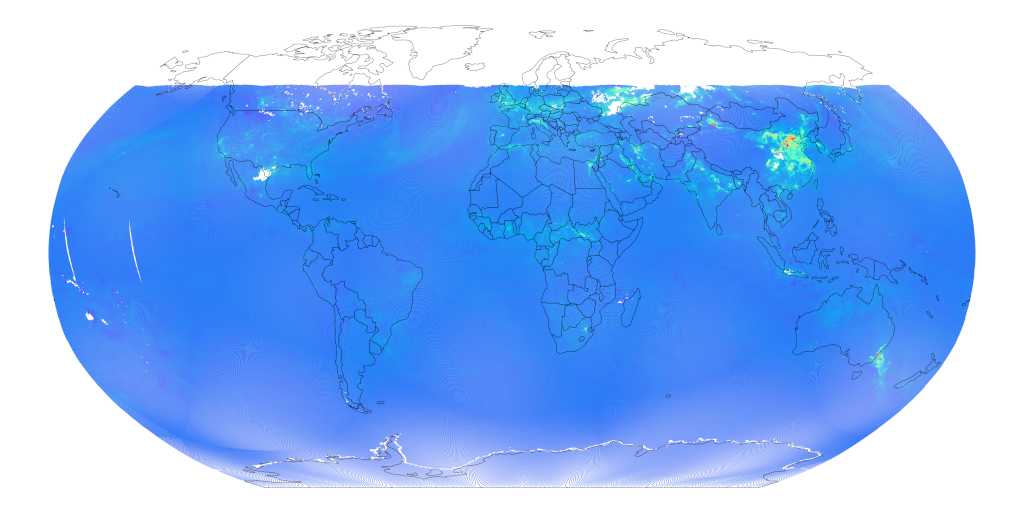
For the second factor, it is important to keep in mind that when we talk about the data we are not talking about ground measurements, but about everything that occurs in the atmosphere.
Another thing that you will notice when working with the data is that there are sometimes what appear to be holes in the data:
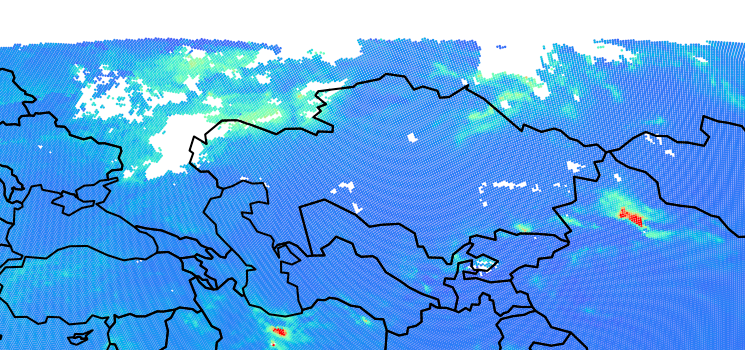
This is due to a reason that might seem somewhat obvious: you need to see the ground to be able to measure the concentrations. In other words, where there are clouds, there are no measurements. Additionally, for Emissions API we discard all the points that are below the quality level recommended by the ESA and thus you will see no data for which the estimate is doubtful.
Spatial Resolution
Since the satellite scans lines of pixels while orbiting around the earth, the spatial resolution is determined by two factors: the number of pixels in the direction of the scan line and the recording frequency in the direction of flight (see figure 48 on the mission page).
Sentinel-5P has a scanline width of approximately 2600 km. The spatial resolution of each pixel on the ground is given with 3.5 km. But due to data processing, the actual resolutions vary depending on the chemical compound between 5.8 km and 12 km. The resolution in the direction of flight for the data is 7 km before and 5.5 km after August 6th 2019.
This spatial resolution is a lot coarser than what you might expect if you think of satellite images you find on the web where it is possible to discern cars and houses. So, with this data it will never be possible to attribute emissions to a very localized source, say, in your neighborhood. But you can analyze patterns at the scale of areas, regions or countries.
Temporal Resolution
Roughly speaking, with Sentinel-5P you get one measurement per day for a given region. The satellite comes up from the south and passes the equator on 13:30 local time. It does so 14 times per 24 hours and, because the earth is spinning underneath it, it thereby scans the surface of the whole earth. Because of the width of the scanline it can thus cover 95% of the area around the equator and 100% of the area at higher or lower latitudes per day (for more technical details see the page on the orbit of Sentinel-5P). This in turn means that, as long as the region your are interested in is not exactly on the equator, you can be pretty sure that you can get one scan per day (provided there is also sufficient light and no clouds). This also means that you only get one scan per day and, since the satellite moves, it is only a short snapshot of each area which will usually take place around 13:30 (depending on the exact time zone and position relative to the equator). For example take this animation of a scan of Germany (timestamps are UTC):
You can see all the data points at the time they were being recorded. The whole scan takes about a minute and a half in realtime to pass over the whole area of Germany. But the total time to complete a scan depends of course on the size of the region you are interested in. If your region of interest spans more than 2600 km in width (like Canada or Russia), i.e. it needs more than one orbit to scan, it will be about two hours longer per additional orbit. This is because the satellite needs approximately one hour to scan one side of the earth and then another hour to pass the other side (where it is night) and come back up. You can get an impression of this from the following animation that iterates through the data of all the orbits of one day, one after another:
For analyses of air quality data this means that you can only see temporal patterns that manifest themselves at scales longer than one day. You could not demonstrate the effects a rush hour has on nitrogen dioxide emissions, for example, because you would never have data during that time of the day. However, you might have a better chance at detecting seasonal variations, like carbon monoxide emissions due to heating in winter.
What kind of questions is the Sentinel-5P data suited for?
As you have seen, satellite based measurements are great to analyze broad spatial trends and patterns. For example, if you want to see differences on the level of countries or compare emissions of regions or cities against each other. If you are interested in spatio-temporal patterns you can think of how wind drives pollutants from an emitting source to affect the air quality of whole areas.
On the other hand, if you are interested in how local traffic affects air pollution on the street crossing near your home, you are better off measuring this directly on site with a sensor (and there are great community projects for that like openSenseMap or sensor.community). However, satellite based data can then help you to monitor places where it is difficult to maintain sensors. Say, if you want to track emissions on ship routes.
As you can see there are numerous possiblities to make use of satellite based emission measurements, especially, if you know how to best use this data. Now that you do, you can hit the ground running and start coding using the Emissions API!